Create an Editable SVG Path with Konva
— JavaScript, Software Development — 7 min read

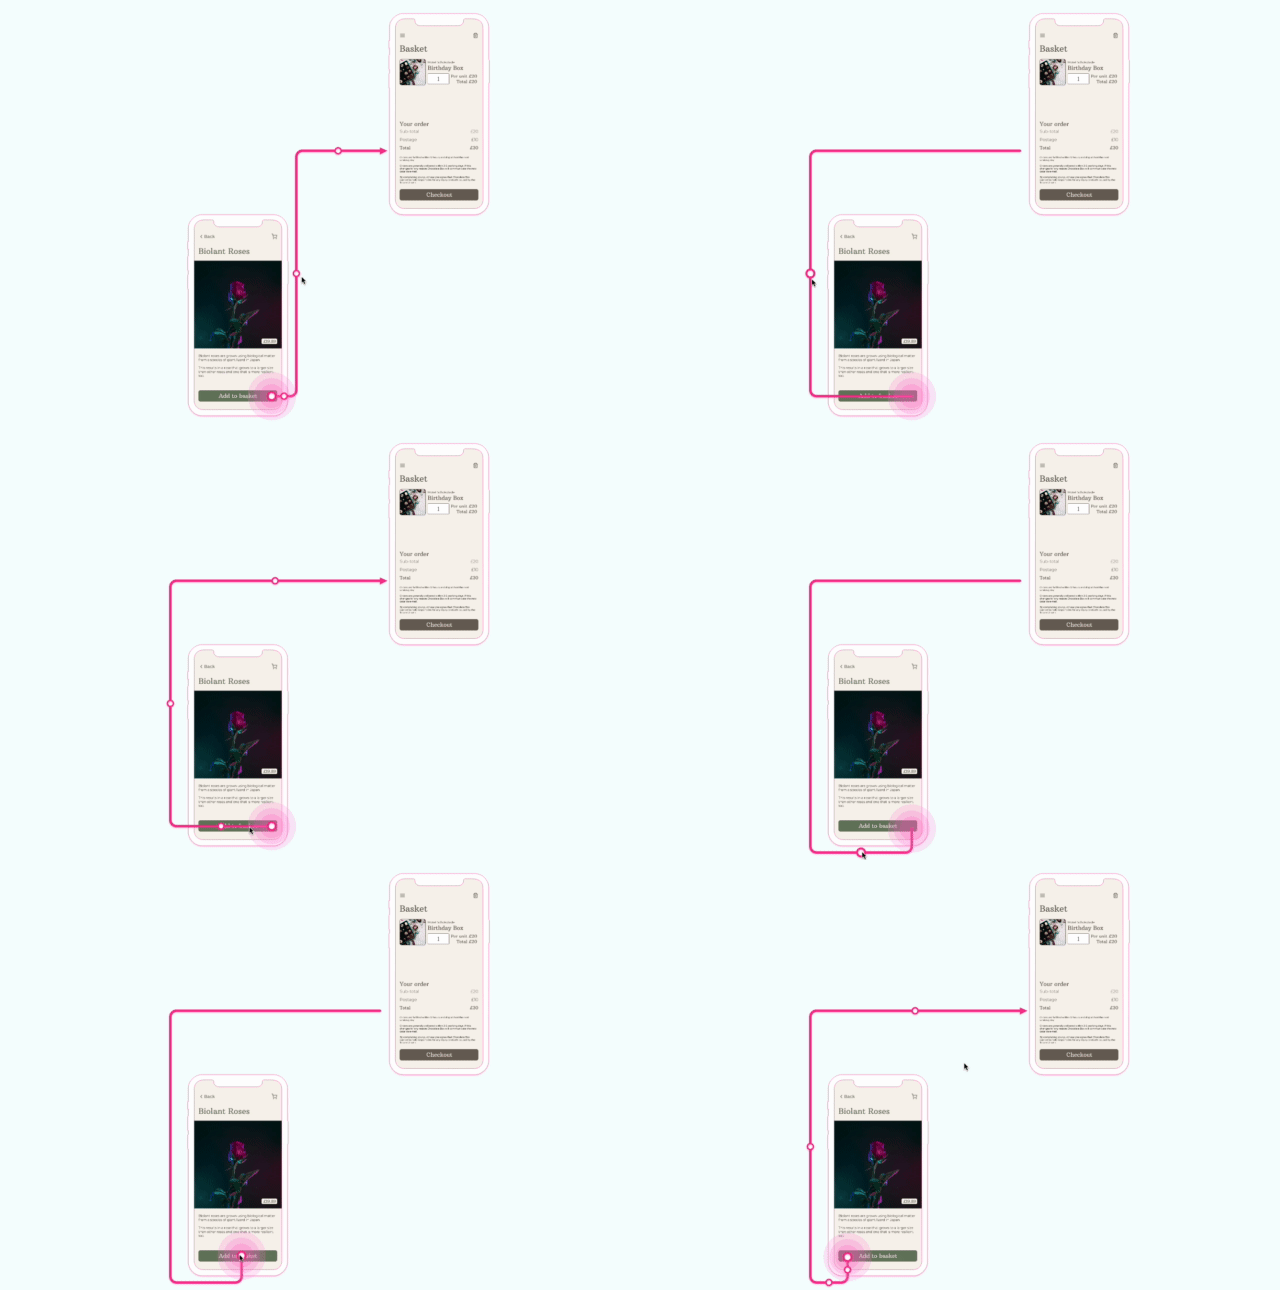
The app I’m currently making (Reciprocal.dev) provides users with an interactive User Journey Map which essentially contains a number of User Journey steps connected together by lines, in a manner similar to a flow chart diagram.
In my previous post I touched on how I implemented the functionality for a user to drag a connecting line from one User Journey step to another using anchors and a preview of the connecting line. If you’ve not read that post you can find it below:
While a basic link between User Journey steps is more than enough for a user to build a map there will be certain journeys that require a means to create custom lines that can be drawn around other objects on the map.
Much like the connecting line preview was inspired by Miro so was my solution to this problem — namely Miro’s stepped line and how it has control points that allow the line’s segments (I like to call these ‘edges’) to be moved about and new segments can be created by moving the controls at the start and end of the line.
While researching how to implement such a line I really struggled to find any resources on how to create a stepped line or even much in the way of updating SVG paths based on the edges of a line instead of individual points. That being the case, I’m hoping that this post helps out those looking to build something similar.
Concerning SVG paths
Before I dive into the details of how I built an editable stepped line I’d like to describe how SVG paths are created and the different approaches I took before I found the technique that worked for me.
An SVG path is created using a list of commands that tell the ‘pen’ where to start from, where to move to and how to end drawing the line. It’s a little similar to the Logo programming tool with the Turtle that you may have used at school if you’re in your 30’s like me.
Here’s a short run down of the different commands. It’s worth noting that lowercase and uppercase versions of these commands act differently, with lowercase meaning to perform the command relative to the current position and uppercase meaning to perform the command at an absolute position.
For example the command h50 will draw a line 50 pixels to the right of the current position but H50 will draw a line to 50 on the X axis.
- M — Moves the pen to the specified point
- L — Draws a line to the specified point
- H — Draws a line horizonally
- V �— Draws a line vertically
- C — Draws a curve to a specific point
- S — Draws a ‘smooth’ curve to a specific point
- Q — Draws a quadratic Bezier curve to a specific point
- T — Draws a ‘smooth’ quadratic Bezier curve to a specific point
- A — Draws an elliptical Arc
- Z — Closes the path by going back to the first point
Each command will have a set of arguments that are appended after the command like M10 10 h50 v50 h-50 Z which will draw a square. The most complex of these are the curve commands (C, S, Q, T) as they have many arguments. I found the MDN tutorials on SVG Paths a lifesaver for understanding these.
Mistakes were made
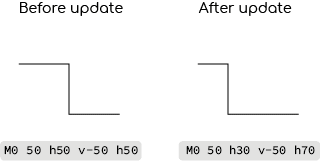
My first approach to implementing an editable SVG path was to use relative horizontal and vertical lines with quadratic Bezier curves for rounded corners.
My thinking was that as my lines are ‘stepped’ there are no diagonal lines so the H and V commands would make it easier to work with when I moved an edge I just needed to get a delta of the movement and apply that to the the adjacent lines of the opposite axis.

While this worked well for moving the existing edges in a line, things got a little complicated when I introduced new edges as this essentially flipped every line to be on the other axis to cater for the new edge.
Lineto to the rescue
I parked the work on building an editable line for a while in order to give myself some time to further research how to achieve my outcome and it was during this time that I found a tool that contained sort of similar functionality to what I wanted, and luckily for me they used SVG in the DOM instead of canvas so I was able to observe the updates to the path command and see what values changed, as I moved things about and adapt that approach for my solution.
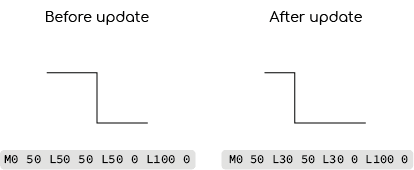
The big breakthrough came when I realised that using absolute positioned lineto ( L ) commands meant that if the source of the command changed the line would still be drawn to that specific point. This meant that I could update and edge and not have to recalculate all the adjacent points, just those directly connected to the updated edge.

Because the path is made of lines this mean that creating new edges in the line was easy enough too, as it just required inserting a new line command in between the existing points.
Working with edges
When the user interacts with the line they won’t be moving the individual points, but instead the edges of the line. Because they are interacting with the edge we need to be able to know what edges are in our path and what type of behaviour these have.
Within my application code I’m using an object representation of the SVG path commands, so instead of L50 50 I have an object that represents a point in the path that looks like:
1{2 command: 'L',3 x: 50,4 y: 505}I then have an array of these objects which allows me to perform calculations against the path. I still need to produce the SVG path data string from these in order to render the updated path though.
Finding edges in the line
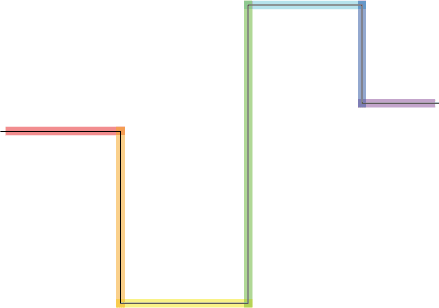
In order to calculate the edges in the path we first need to understand how those edges are formed from an array of points. Because we’re creating a stepped line this is pretty easy to calculate as the X or Y axis will be the same for the edge as the difference is on the other axis.

In order to calculate the different edges we can iterate and reduce the list of points into an list of objects that store the axis (calculated by the X or Y value being the same between points) and the start point (the point at the current index) and end point (the point at the next index in the list).
There are different types of edge we need to detect in order to implement the extrudable behaviour of the line. We want the first and last edges (lets call these ends) of the line to behave differently to those those ‘inside’ the line as dragging the end edges should create a new edge instead of just updating the position.
In order to make the code easier to read I’ve created two separate arrays for the different points, but you could also use one array with an additional property that details the behaviour dragging the edge should have.
1export function getControlPointAxis(point1, point2) {2 if (point1.y === point2.y && point1.x !== point2.x) {3 return "y";4 }5 return "x";6}7
8function calculateExtrudableEdges(points) {9 const endPoints = [points.length - 2, points.length - 1];10 return [11 {12 axis: getControlPointAxis(points[0], points[1]),13 points: [0, 1]14 },15 {16 axis: getControlPointAxis(points[endPoints[0]], points[endPoints[1]]),17 points: endPoints18 }19 ];20}21
22function calculateDraggableEdges(points) {23 return points.reduce((edges, point, index) => {24 if (25 index === 0 ||26 index === points.length - 1 ||27 index + 1 === points.length - 128 ) {29 return edges;30 }31 const nextIndex = index + 1;32 edges.push({33 axis: getControlPointAxis(points[index], points[nextIndex]),34 points: [index, nextIndex]35 });36 return edges;37 }, []);38}39
40export function calculateEdges(points) {41 const extrudableEdges = calculateExtrudableEdges(points);42 const edges = calculateDraggableEdges(points);43 return {44 edges,45 extrudableEdges46 };47}Adding control points to these edges
Now we know what the edges are in the line, we need to give the user something to interact with (I call these control points) in order to update the line into whatever shape they want.
Adding control points along the line is relatively easy once you’ve got an array of edges as you just need to know what axis the edge is along and position the control point in the middle of that axis (as the position along the other axis is the same between both points).
1export function getControlPointCoords(points, edge) {2 const affectedPoints = edge.points.map((i) => points[i]);3 const otherAxis = edge.axis === 'y' ? 'x' : 'y';4 return {5 [otherAxis]: affectedPoints[0][otherAxis] + (affectedPoints[1][otherAxis] - affectedPoints[0][otherAxis]) / 2,6 [edge.axis]: affectedPoints[0][edge.axis],7 }8}With the control point in place, we then need to make sure that the user can only drag the control point along the opposite axis (so if the edge is along the Y axis we want the control point to move along the X axis). This is done using a drag bounds function.
The dragBoundFunc needed to lock the dragging to one axis is similar to that used in my previous post for the connection creation anchor. That used a ref to the shape the user dragged and used getAbsolutePosition to return the position of the shape which we return to keep the point static. However, as we want to move along one axis we instead return the updated position for that axis and use the static value for the other axis.
1function dragBoundFunc(pos, axis, anchorRef) {2 const staticPos = anchorRef.current.getAbsolutePosition();3 const otherAxis = axis === 'y' ? 'x' : 'y';4 return {5 [axis]: pos[axis],6 [otherAxis]: staticPos[otherAxis]7 }8}To update the line on drag we add the onDragStart , onDragMove and onDragEnd callbacks to our control point with onDragMove being used to update the line.
Updating the line when moving a control point
When the control point is dragged, we want one of three behaviours, depending on the position of the control point along the line:
- If the control point is at the tip of the line then we want it to update the position of itself and also the point adjacent to it, so that the edge is moved and the length of the edge changes accordingly
- If the control point is in the middle of the edges and the end of the line, then we want to create a new edge between the tip and this edge so it feels like dragging the edge has ‘extruded’ a new edge into the line
- If the control point is between the ends of the line, then we want it to update the position of the edge along the opposite axis
In order to determine the behaviour of the control point in the onDragMove callback. For ease of reading I’ve rendered four different components with the callbacks on them, but this could be done with one array using the edge’s behaviour property to determine how the path is updated.
Updating the end edges on moving tip
1export function updatePathFromTip(path, index, position) {2 // clone points and update position3 const newPoints = [...path.points];4 newPoints[index] = {5 ...newPoints[index],6 ...position7 };8 // Get the index of the other point to update9 const otherIndex = index === 0 ? 1 : index - 1;10 // Calculate the axis that the edge leading to the tip is on11 const axis = path.points[index].y === path.points[otherIndex].y ? "y" : "x";12 // If the position has changed then update the value on the axis to move the edge with the tip13 if (position[axis] !== path.points[index][axis]) {14 newPoints[otherIndex][axis] = position[axis];15 }16 return {17 ...path,18 points: newPoints19 };20}Extruding the end edeges
1export function updatePathFromExtrude(path, edge, position) {2 // Create copies so can mutate them3 const newPoints = [...path.points];4 const newExtrudableEdges = [...path.extrudableEdges];5 const newActiveDrag = path.activeDrag;6 // Set up configuration, check if starting edge, get the axis to update and the other axis7 // with the node to base the other axis' value off8 const isStartEdge = edge.points[0] === 0;9 const axis = edge.axis;10 const otherAxis = edge.axis === "y" ? "x" : "y";11 const nodeToUpdate = isStartEdge ? 0 : 1;12
13 // update edge's axis with the current position14 newPoints[edge.points[0]][axis] = position[axis];15 newPoints[edge.points[1]][axis] = position[axis];16
17 // Check if the extruded flag has been set, that means we should create the new edge to extrude18 if (!path.activeDrag.extruded) {19 // Create the new edge using the current axis position and the other axis value from the next or previous point depending on20 // if the extruding edge is at the start or end21 const newCommand = {22 command: "L",23 [axis]: position[axis],24 [otherAxis]: newPoints[edge.points[nodeToUpdate]][otherAxis]25 };26 // Add that new line command into the array after the first line27 newPoints.splice(edge.points[1], 0, newCommand);28 // Set extruded to true so we don't create anymore new edges during the active drag29 newActiveDrag.extruded = true;30 // Update the drag handles so UX wise it feels like we're extruding the edge although at this point31 // we're actually setting the coordinates on the new edge32 if (isStartEdge) {33 newExtrudableEdges[0].points = [1, 2];34 newExtrudableEdges[1].points = [35 newPoints.length - 2,36 newPoints.length - 137 ];38 } else {39 newExtrudableEdges[1].points = [40 newPoints.length - 3,41 newPoints.length - 242 ];43 }44 }45 return {46 ...path,47 points: newPoints,48 extrudeableEdges: newExtrudableEdges,49 activeDrag: newActiveDrag50 };51}Updating the middle edges
1export function updatePathFromMiddle(path, edge, position) {2 const newPoints = path.points.map((item, index) => {3 if (edge.points.includes(index)) {4 return {5 ...item,6 [edge.axis]: position[edge.axis]7 };8 }9 return item;10 });11 return {12 ...path,13 points: newPoints14 };15}Once we’ve calculated the new path we update the path in state, which will then cause a re-render of the points and update the line the user sees.
Demo
I’ve created a little demo of the approach I’ve taken to create an editable SVG path below. Dragging one of the control points on the line will allow you to edit it.
Conclusion
I was really happy when the ball dropped on how to solve this problem as it feels like while multiple products offer this functionality there is next to no documentation on it.
With users being able to edit SVG paths, the maps that are created with Reciprocal.dev are now flexible to facilitate a number of different mapping needs which keeping the UX to alter the paths simple and easy to use.