Managing upstream API dependencies with User Journey focused regression testing
— Testing, User Journeys, Automation, Software Development — 7 min read
Most software development involves Application Programming Interfaces (APIs). An API is a means for developers to access and manage external applications such as back-end web servers or hardware.
If you’re lucky these APIs are:
- Well documented with plenty of examples
- Have a status page to check the availability of the API functionality
- Follow a strict release management process
- Have a development team that’s readily available to help you
My experience of APIs unfortunately never meets all of these points.
There’s a practice in development which is to treat the API as a contract of functionality. The idea is that the API team publish documentation (using Swagger or other tool) that other teams can develop against with a guarantee that the API in production will work as documented.
While the contract gives an indication of how one might use the API, it doesn’t help with issues around API availability and depending on the API team’s release management process you might find that on a whim the contract is invalidated by a last minute push.
To better protect my team from changing upstream API changes I’ve found that automating User Journeys via these APIs helps protects against functional regressions while giving a clear visualisation of the impact that changes and downtime have on the end user.
I first learned about this concept in Sam Newman’s Building Micro-services where this is referred to as Semantic Monitoring, where the aim is to run your end-to-end tests in production and use your monitoring tools to measure the performance of the system while showing the impact the system has on the user’s experience over time.
What are User Journeys?

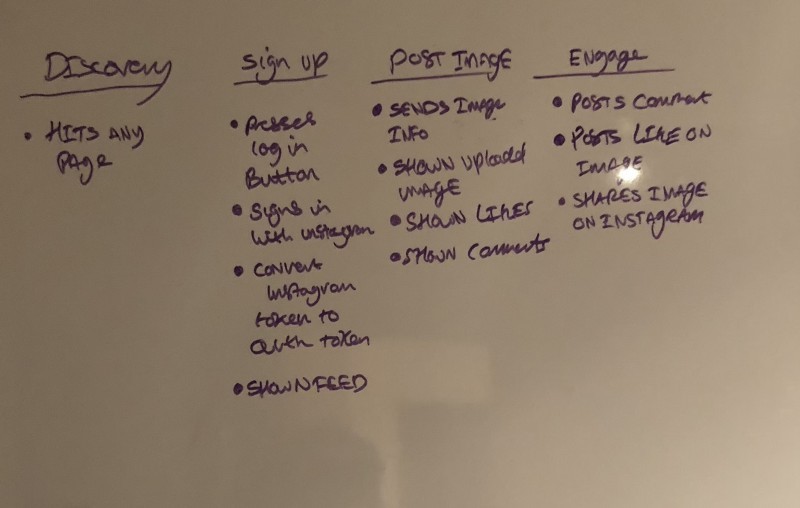
User Journeys are used to illustrate how the user interacts with the product to reach a particular goal, an example of this might be a user adding an item to their basket on an e-commerce website after seeing a recommend item:
- User hits the landing page
- User sees promotion for the item
- User clicks the promotion to find out more
- User decides they want the item and adds it to their basket
- User goes to check out
- User fills out address details
- User fills out payment details
- User submits both address and payment
- User sees order confirmation screen
For each of these steps there could be a number of services working together to serve up content and handle input:
- The promotions could be served up by a separate API from the main shop listing
- The basket contents might utilise a 3rd party API that analyses basket retention rates
- The address form might offer to auto-fill the address based on a postcode, this will usually use a 3rd party API
- The Payment form will most definitely use a 3rd party API, unless the business has the means to manage this in-house
This example of course is a simplification of the process but hopefully illustrates a point of how even a simple flow might utilise a number of APIs that teams may or may not have control over.
Who should set out which User Journeys to automate?
While the development and QA teams might be the people paying attention to the end result of the API tests, it’s really the job of the entire team to help prioritise the User Journeys to be automated by identifying the journeys that are the most valuable to the user.
Those on the more business-facing side will have more insight into what the critical paths of the product are and the impact of broken functionality will have.
Those on the more functional side will have more insight into the different responses returned via the API and the data needed to passed between calls, such as session tokens.
Knowing which APIs are called during a User Journey
For the sake of this post I will be automating a RESTful JSON based API over HTTP, but there’s no reason you couldn’t automate any other API, as long as you have a means of collecting the different calls made to complete a flow.
Collecting the calls in a browser such as Chrome is pretty easy. You simply bring up Dev Tools, select the Network tab and as you interact with the page it should populate with the images, scripts and network requests to APIs etc. If you press the XHR filter that will show just the API calls being made.
Each entry will give details on the URL and the verb used (POST, GET etc) and the request details will show the headers and data submitted.
Automating the API calls

I’ll be using a tool called Postman but there’s no reason you couldn’t use another tool, such as a collection of cURL calls or a Python Script.
I like Postman as it provides a really useful GUI over common API related tasks and it has a folder structure which allows for grouping API calls. It also has some nifty tools for adding variables into the flow from environment files and global variables added during execution.
To turn the list of API calls we get from the Chrome Dev Tools into something we can run in series we need to create a collection in Postman. This collection firstly groups the calls but also allows us to export the calls later so we can run them on a CI server.
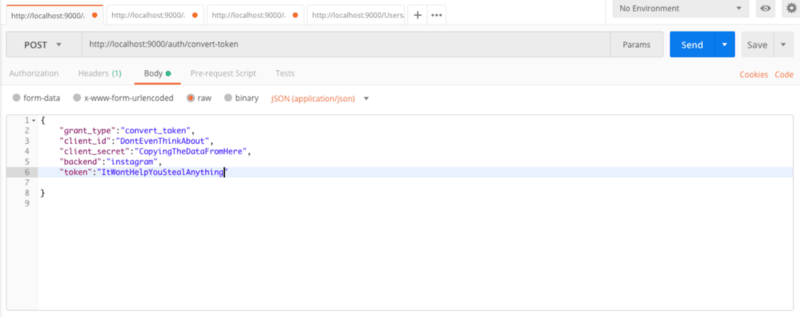
Once we’ve got a collection we then need to create an entry for each API call. You do this by entering the URL and the Verb into the top bar, add the headers into the headers tab and adding the request body into the body tab.
The real power of Postman comes from the pre-request and post-requests scripts. These allow for values to be extracted from the response and saved into a global variable so they can be re-used in a later call (saving a oAuth code for authentication for instance). These variables can be used anywhere in Postman, in URLs, in headers, the request body and in scripts.
One downside of Postman is that it doesn’t offer a means to reuse steps so you can define them once and then use them in many collections, this being the case it’s OK to duplicate calls between collections as the value comes from seeing the impact of the call failing and not from our collections being optimised.
Using dynamic data in your automation
There may be time where it’s not possible to use the same data set for different test runs due to constraints such unique email addresses for new registrations, to bypass this you’ll need to use dynamic data.
Luckily Postman offers a Pre-Request script option that allows you to set global variables (variables within the scope of the test run only) before executing the request. This means you can use things like the uuid package to create a unique email address for that test (I’ve found mailosaur really useful for this)
Postman comes with a number of libraries for generating and handling data. You can find a list on the Postman website.
Another use case of dynamic data would be session tokens. You may have a call to an endpoint where you pass the username and password and receive a token to use for authentication when making subsequent calls. In order to pass this value to the other calls you can use the tests offered by Postman to set a global variable.
To handle changes from different environments such as different URLs or endpoints you can use the environments feature. This allows you to create different constants for different environments and then add placeholders into your request URLs, headers or even read them from your scripts.
Running the tests
Postman has a collection runner built into it. If you press the arrow on the right of the collection in the sidebar there’s a Run option. This allows the collection calls to be run in order and gives you a nice little test report view.
Next to that Run option there’s a Share button, this allows the collection to be exported to be used with Newman, a CLI tool that offers the same functionality as the in-built Postman test runner. We’ll use Newman to run the collection on CI.
When it comes to running the collections on a schedule there are a few options; you can use Newman and a cron job or you can use the Postman monitor functionality which gives you 5000 free runs a month.
I’ve opted in my case to use Newman and use a cron job on Travis to run my tests every day. I chose this option as it allows me execute any additional scripts before running my Newman collection and then export the report to another service such as SonarQube.
Reporting

In order to understand the outcome of the tests we need to have some means of reporting on what passed and what failed. If you’re running the test from within postman the report will be in the runner interface and you’ll see which tests passed and which tests failed, as well as right click to see the requests and responses sent.
If you’re running these tests in a CI environment you’ll want some form of dashboard to show the data over time with the ability to see individual test runs for when things fail.
Newman has by default a JUnit reporter for compiling test run data and a HTML report for viewing more human-readable reports on the test runs. I have found however that this HTML report doesn’t really help you track down issues when the tests fail as there’s not enough data on what was sent or what the response looked like.
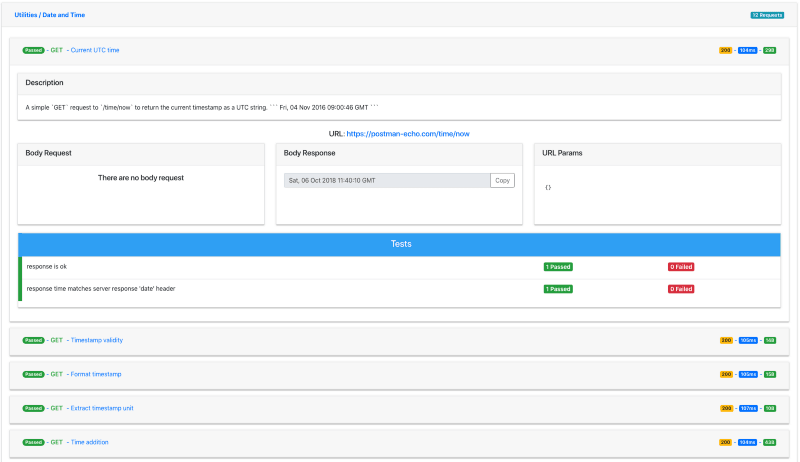
There is, however, a report that you can use relatively easily with Newman that does all this — the aptly named Awesome Newman HTML Template. To use it just clone the project and pass the template to Newman via the --reporter-html-template command line arg.
Issues with Postman & Newman
While Postman and Newman have many strengths, they have a few issues.
Version control of collections and calls isn’t built in, so aside from exporting the set of calls so you can import should you need to roll back, or creating a lot of different collections for different code versions, there is no means to version the tests so you can manage test compatibility.
Environments aren’t served up from Postman in the same way that collections are when you share them. When hooking up Newman to run a collection it’s easy to pass it a link to that collection on Postman’s servers, but the environment variables need to manually hosted somewhere.
Lastly there’s the lack of detail in the inbuilt HTML report, this isn’t a big issue but the Postman runner has all the data in it and Postman is an electron app, so there’s no reason the HTML report couldn’t reuse assets from that interface.
Summary
- By testing the User Journey you can visualise the impact of APIs going down & changing on the user’s experience of the site
- Postman is a really good tool for creating API level tests in a easy to use GUI environment
- Newman is great taking those postman tests and running them in CI to provide continuous reporting on the state of the APIs
- Use global variables in pre and post request scripts to pass dynamic values between calls in a collection to make your API tests more resilient